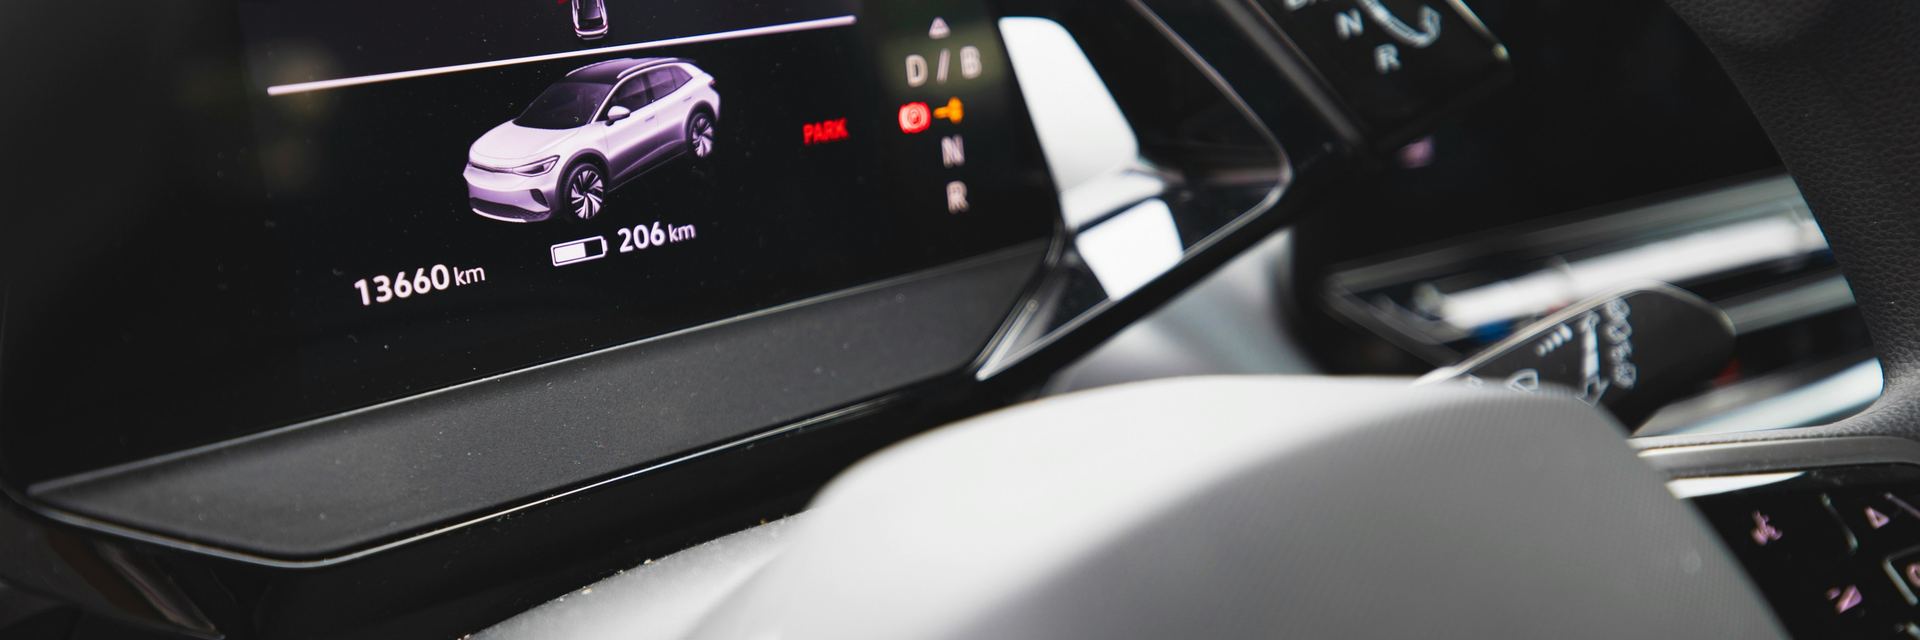
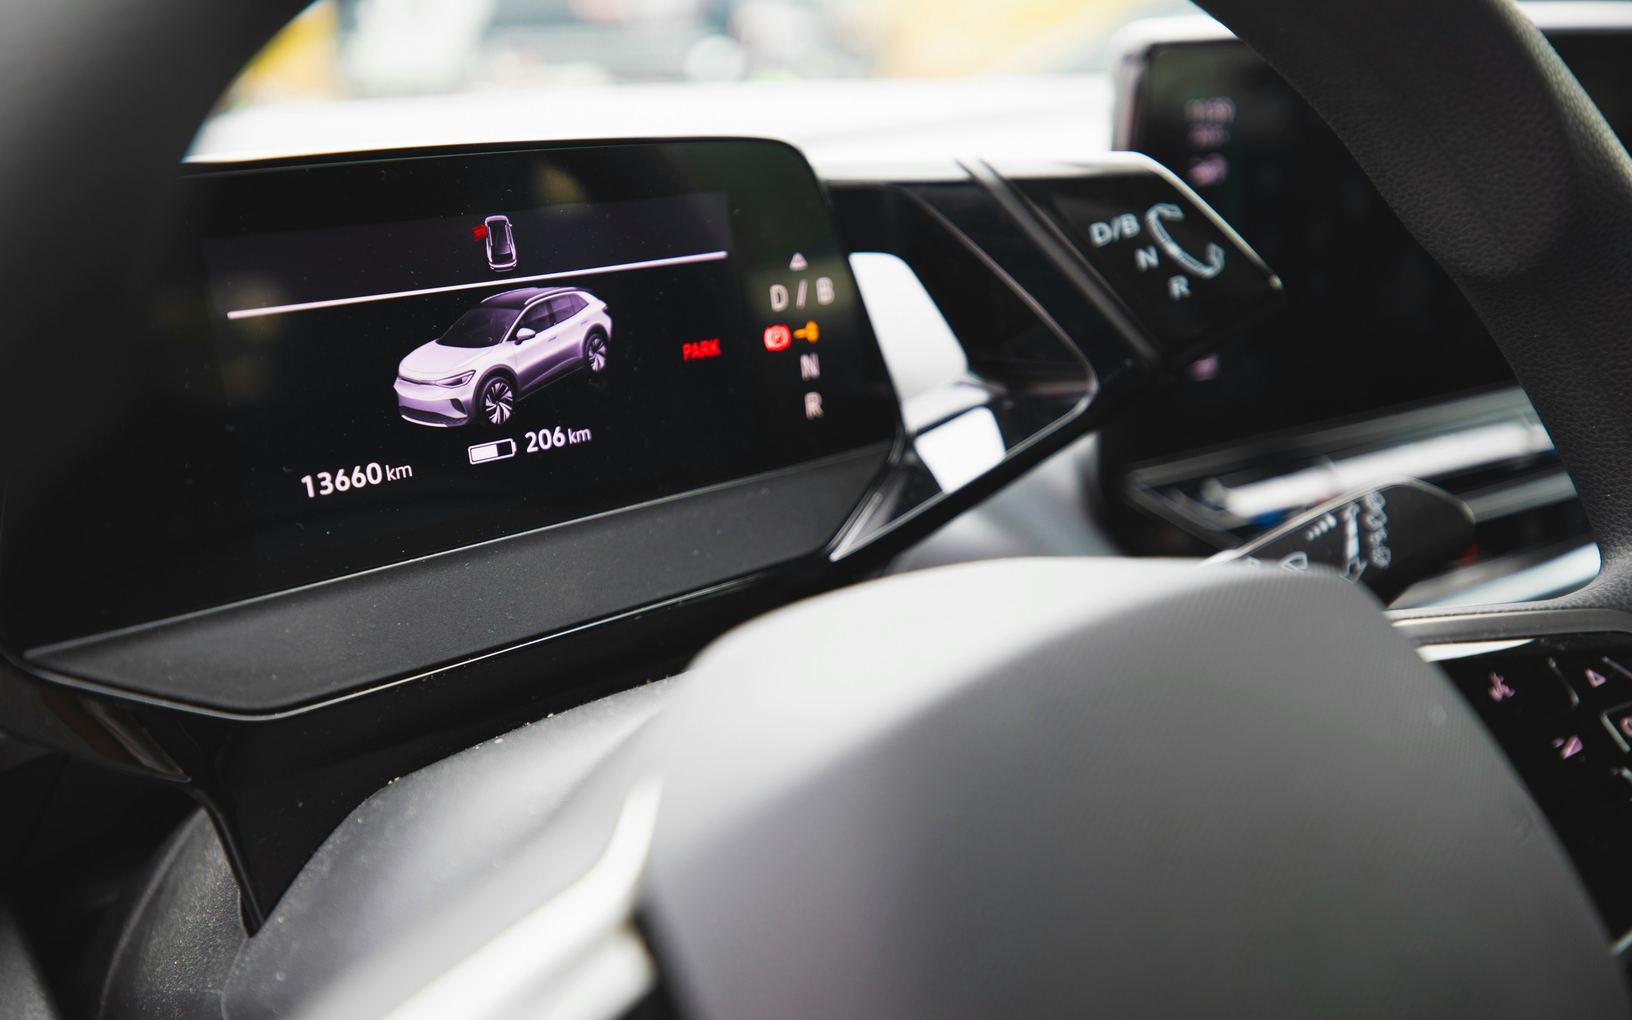
The range figure on the dash looks like a measurement, but it is a forecast. The car takes the energy left in the battery and divides it by how much it thinks you will use, and that second part is a guess. Once you know what feeds the guess, the number stops being a worry and starts being a tool.
What the number on the dash actually is
A gas gauge shows what is in the tank; a range estimate shows what the car expects you to do with what is in the battery. Some cars base the forecast on your recent driving, some on a standard rating, and some blend the two. The owner's manual says which method yours uses, and that tells you how jumpy to expect it to be.
Because the forecast leans on recent habits, it carries the last drive into the next one. A long highway run at speed leaves a lower estimate the next morning, even for a short trip across town. A week of gentle errands does the opposite and can make the figure look generous before a fast highway drive.
Why the estimate drifts during a drive
Anything that changes how much energy the car uses per stretch of road changes the forecast. Speed matters most on open roads, because pushing through air takes more effort the faster you go. Climbing a long hill pulls the number down, and coming back down can lift it again as the car recovers energy on the way.
The cabin heater and air conditioning draw on the same battery as the motor, so the estimate reacts when you change the climate settings. Weather adds its own swing, which the articles on cold winter climates and hot summer climates cover. Extra weight, a roof box, a bike rack or soft tires all nudge the figure down too.
- Higher speeds on the highway
- Long climbs, headwinds and rain on the road
- Heating or cooling the cabin
- A roof box, a bike rack or a full trunk
- Tires that have lost pressure
Screens worth opening at least once
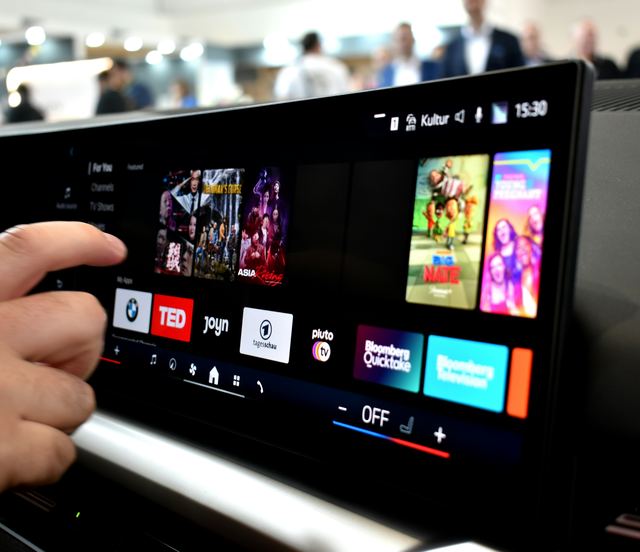
Most electric cars have more to show than the dash. An energy or consumption screen plots how much the car has used over recent driving, so you can see the effect of a fast stretch or a cold start. Some cars split the use into driving, climate and other systems, which shows at a glance where the energy went.
The trip computer usually has a meter you can reset, which turns into a record of a typical week if you clear it on a Monday. The navigation system may also forecast the charge you will have on arrival. That forecast accounts for the route, its hills and its speeds, so it tends to be steadier than the plain estimate.
- A consumption graph over recent driving
- A breakdown of energy used by driving and by climate
- A trip meter you can reset yourself
- The arrival charge forecast in the navigation
Showing the charge in a steadier form
Many cars let you switch the main display from a distance to the battery's charge level. The charge level only moves when energy is actually used or added, so it does not leap about when the forecast changes. Plenty of drivers find it calmer to watch, and it is the same unit the charging screen and public chargers use.
Treat distance and charge level as two views of one battery. Use the charge level for day-to-day decisions, such as whether to plug in tonight, and the navigation's arrival forecast for longer drives. The article on planning an EV road trip goes further into using that forecast on a long journey.
What happens as the battery runs low
The car warns you as the charge falls, first with a message and then with stronger alerts. Many cars then limit power, turn down climate control or switch off comforts to stretch what is left. The owner's manual describes the stages for your car, and it is worth reading before you ever see them.
Do not count on a hidden reserve below the bottom of the display. Certain cars keep a small margin back while others give you everything, and the owner's manual says which applies to yours. Plan to reach a charger with charge to spare, and use the navigation to find one before the warnings start.
What to take away
- The range figure is a forecast built from recent driving
- Speed, hills, climate and weight move it during a drive
- The charge level is steadier to watch than the distance
- Use the navigation's arrival forecast for longer drives
Try it while parked
- Switch the main display between distance and charge level
- Find the consumption or energy use screen
- Reset a trip meter so it records a whole week
- Enter a destination and read the arrival charge forecast
- Turn the climate on and watch the estimate respond
Questions
The sticker figure comes from a standard test with set speeds and conditions, while the dash estimate reflects how and where you have been driving. Faster roads, climate use and weather can all put your figure below the sticker. A steady drop over many months on mild days is a different matter and worth raising with the carmaker's service department.
The forecast learns from recent driving, so a different driver with a heavier foot or a longer highway run changes it. Some cars keep a separate profile for each driver, which can keep the history apart. Give it a few days of your own driving and the estimate settles back toward your habits.